Every Engagement Gets a Graph
Four client knowledge graphs in five months. Local extraction on my own GPUs, agentic research and writing chains on top, and the eval discipline that's slowly turning it into a repeatable consulting tool.
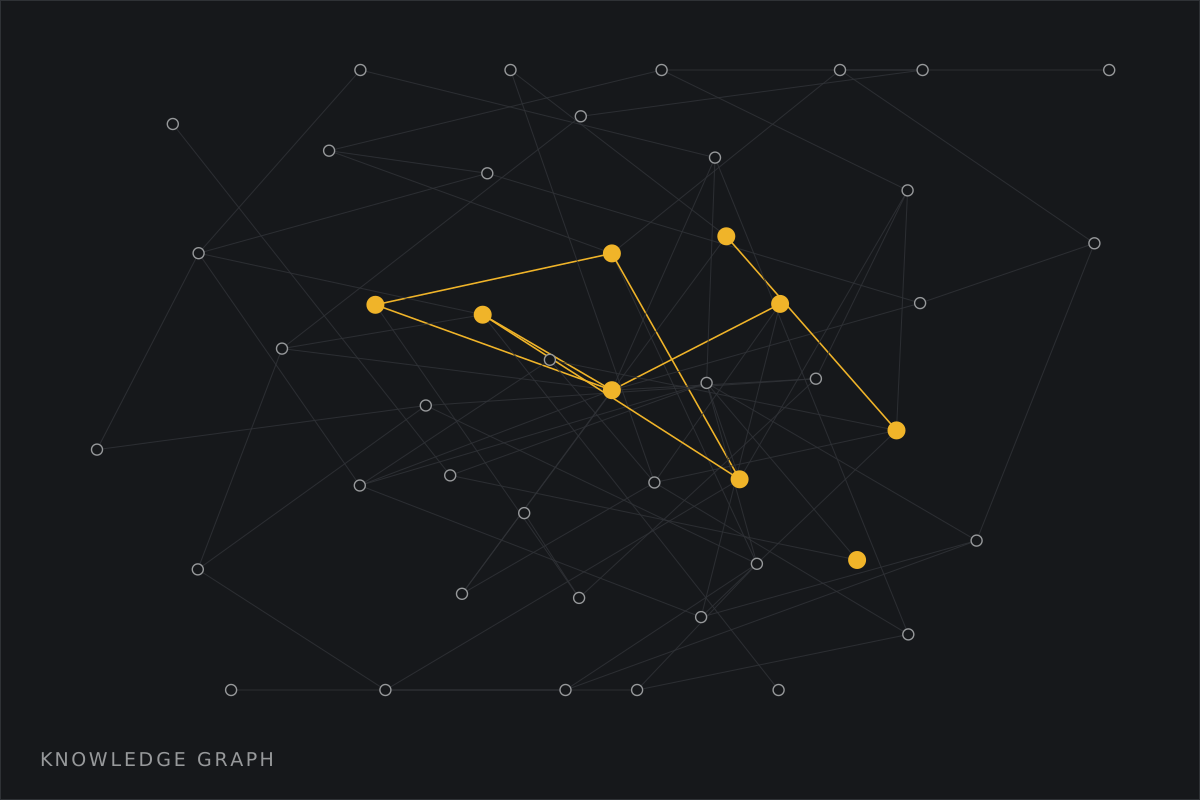
Somewhere around the third consulting engagement I noticed I was building the same thing every time: take whatever documents the client actually has, extract the entities and relationships hiding in them, wire it all into a knowledge graph, then let agents interrogate the graph instead of the raw pile. So I stopped pretending each build was bespoke and started treating it as one tool that gets sharper per engagement. I’m on the fourth generation of it now.
What goes in
The inputs are never clean. One engagement involved a decades-deep product catalog spread across DOCX, PDF, PPTX and XLSX, hundreds of files of it. Another was built from stakeholder interviews, recorded and transcribed with everyone’s consent, fifteen to twenty of them, which sounds small until you try to hold every process handoff mentioned across all of them in your head at once. A third was industry analysis, so the corpus was scraped and collected public material, which eventually became an enrichment set 967 files deep.
Different shapes, same move: convert everything to a common intermediate, chunk it, and push it through an extraction model that emits structured JSON against a fixed ontology. Fifteen entity types on the catalog build. Seven on the industry one. The newest one is organisational, so the ontology is processes, workflows, handoffs and teams, which is a fun thing to extract from interview transcripts because nobody describes their own job the same way their colleagues describe it.
Extraction runs at home
All of this runs on my own GPUs (the same basement fleet from the harness write-up), with a 32B model doing the extraction behind a load balancer, eight backends round-robining chunks. Client documents don’t leave the building- that’s not a compliance checkbox retrofitted later, it’s the reason the fleet exists.
Extraction at volume is where the fun bugs live. Spreadsheets were failing at 30 to 65% for a while, always with JSON truncated mid-string, while narrative documents sailed through at 0%. Turns out spreadsheet chunks are entity-dense: the model generates far more output per chunk, and the backends were configured with enough context for the prompt but not always enough left over for the answer. The model would just stop generating mid-bracket, wherever it happened to be standing. Doubled the per-slot context, quantised the KV cache to pay for it, halved the batch sizes, added one retry for truncations. Error rate on the worst file type went from 30% to about 2%. The fix was infrastructure, not prompts. It usually is.
The graph part
Early builds didn’t use a proper graph database. The current one runs Memgraph with a schema file and actual migrations, because a graph you rebuild from scratch every time you change your mind about an edge type is a toy. The middle builds went the other way- one of them is just NetworkX plus full-text search, because 967 enriched files genuinely do not need a database server, and admitting that saved a week.
The part I now consider non-negotiable is provenance. Every node and edge carries a pointer back to the exact source document and chunk it came from. When a client asks “where did that come from?” in a readout, the answer is a filename and a paragraph, not a shrug. That one property is most of the difference between a knowledge graph and a very expensive diagram.
There’s also a hygiene layer that took an embarrassing amount of iteration: dedupe (the same product appears 40 times across 40 catalogs with 39 spellings), reconciliation against known constraints, and schema checks. This is packaged as skills the agents invoke rather than scripts I remember to run, which matters, because I don’t remember to run scripts.
Agents on top
The graph on its own is just well-organised data. The useful layer is agentic chains running against it: research rounds where an orchestrator fans questions out to local models, which crawl the graph and report back with citations; enrichment passes that re-run over the corpus as the ontology improves; and writing chains that draft readout sections and deck content grounded in graph queries rather than in whatever the model feels like saying. The deliverable at the end is normal consulting output, a report, a deck, a recommendation. The difference is that every claim in it traces back through the graph to a source document, and drafting it took a chain of cheap local calls instead of a week of my evenings.
Making it repeatable
The thing that’s actually turning this from “stuff I do” into a tool is the eval discipline, learned the hard way. Before trusting any model swap, the pipeline gets run against a known-answer corpus, 15 staged files in three difficulty tiers where I already know what a correct extraction looks like, with a 95% gate before anything gets promoted. When I scored one incumbent setup against our own labels it came back with a micro-F1 of 0.29. Ouch. Without the eval suite that number would still be in production, quietly wrong at scale.
What survives from engagement to engagement now: the conversion and extraction pipeline, the ontology patterns, the hygiene skills, the provenance scheme, the eval harness, and an escalation ladder that sends easy chunks to cheap local models and only pays for a frontier model on the failures. What changes per client: the ontology itself and the corpus. That ratio keeps improving.
The same shape, past the client work
What surprised me is how often that shape turns up once you’ve built it once. I’ve got a couple of research projects going that have nothing to do with consulting, one tracking the XR industry by ingesting talks and papers and video and distilling them into structured notes an agent can write analysis from, another building a systems-modelling research instrument that scrapes the academic literature into a corpus. Neither of them imports a line of the consulting code. They just independently ended up with the same pipeline: pull in the mess, extract the structure, then query that instead of the raw pile. The XR one stops at curated notes for now, the modelling one is about to grow itself a proper graph. I didn’t plan that convergence, it just keeps being the right move.
The part that’s actually hardened isn’t any single graph, it’s the machinery underneath all of them. It’s templated now, version-controlled, and pushed to every box with a dry-run and a verify step before anything lands, so a new project starts the day with the extraction spine, the eval gates and the graph-hygiene skills already wired in rather than me rebuilding them by hand for the fourth time. The oldest build has gone furthest down that road: the graph there isn’t touched by loose scripts anymore, every mutation goes through a checkpointed skill that keeps an audit trail, sitting on a proper multi-package codebase with a test-coverage gate I’m not allowed to lower just to make a red build go green. It stopped being a pile of extraction scripts and turned into a tool with opinions.
Whether any of this becomes an actual product I’m genuinely not sure yet, and there’s a whole research track chewing on exactly that question- what it would take, what already exists, where the line sits between a sharp internal tool and a thing other people could run. No decision made. But the components keep getting more solid, more automated, whether or not I ever draw that line, and generation four went from kickoff to a working graph in under a week. I’m curious what the number is by generation six, and whether by then it’s still only mine.